.:: [Problem
The next step is to load the binary. As we can see on Figure 6, IDA is loading an ELF64 executable.
Analysts can visualize and navigate through a graphical representation of the ELF binary file and can use almost all debugging features provided by IDA. This commands will be transmitted to the Host machine for controlling the execution flow of the analyzed binary. Figure 7 shows the main graphical interface of IDA containing the disassembled code of the analyzed binary (hosted in a remote machine).
.:: [References:
[1] http://bochs.sourceforge.net/
[2] https://www.hex-rays.com/products/ida/
[3] http://www.ollydbg.de/
[4] https://www.hex-rays.com/products/ida/support/download_freeware.shtml
[5] http://www.howtogeek.com/168115/mount-a-windows-shared-folder-on-linux-with-samba/
[6] http://windows.microsoft.com/en-za/windows/share-files-with-someone
[7] http://linux.die.net/man/1/gdbserver
Recently I had really hard time reversing and debugging a small crypto application for Linux (an ELF binary). I tried to use Bochs Emulator [1] (together with IDA) which crashed every single time I tried to load the executable. I could not find any tool native for Linux reasonably intuitive and with a built-in pack of useful analyses such as IDApro[2] and OllyDbg[3]. I ended up going Cowboy style by using Objdump, GDB and printed assembly code directly.
 |
| Fig 01 - Cowboy Style Reversing |
All this headache could be avoided by using the Remote Debugging feature supported by IDA. This post describes some research results on "reversing and debugging ELF binaries using the remote debugging feature of IDA pro".
.:: [Research Results
Remote debugging capability is available since IDA version 4.8. Although the free version of IDA is 5.0 [4], it does not offer the Remote Debugging functionality.
For this article makes use of two different environments and it was used the following nomenclature as a convention:
- Host environment - a Linux Operating System machine used for hosting the analyzed ELF binary;
- Analysis environment - a Microsoft Windows 7 machine where IDA is installed and all analyses should be performed.
The first step is to copy the "debugging server" application from the Analysis to the Host environment. This server is provided by IDA and is located inside its root directory in a folder called "dbgsrv". Figure 02 shows the file path for the different versions of debugging servers offered by IDA.
 |
| Fig 02 - Remote Debugging servers folder |
Note that IDA provides different versions servers for different architectures. You should choose the version which fits your Host machine architecture specification. "linux_server64" server was chosen once the Host environment is a Linux Ubuntu Server 64 bits. This executable should be copied to the Host environment.
A folder was shared between the Analyzer and the Host environment. A work directory called "dbgsrv" was created and the "linux_server64" binary was copied into this directory (accessible by both machines). A "test" binary was used to demonstrating the whole Remote Debugging process. This binary has also to be copied into the shared folder. Describing how to share a folder on Windows and access it through Samba are out of scope for this article (but you can easily find this information on any search engine [5] [6]). Figures 3 and 4 show the shared folder content on both environments.
 |
| Fig 03 - Shared folder, files and file type on Linux |
 |
| Fig 04 - Shared folder and files on Windows |
The server will will act as a proxy for all interaction between the analyzed process and the Operating System. Information about interaction will be transmitted to the Analysis environment through a TCP connection using port 23946. Figure 5 presents the command line for executing the server into the Host environment.
 |
| Fig 05 - linux_serverx64 server output |
The next step is to load the binary. As we can see on Figure 6, IDA is loading an ELF64 executable.
 |
| Fig 06 - Loading ELF executable into IDA |
 |
| Fig 07 - Graph visual interface for the analyzed ELF file. |
Finally, the last step is to configure IDA running at the Analysis machine to connect to the server executed at the Host environment.
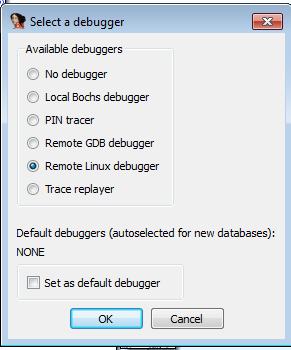
For this step it is necessary to access the menu: "Debugger" -> "Select a Debugger". This menu has a list of options for debuggers. Figure 8 shows all possibilities for Debugging technologies. There are many options for Remote Debugging a process but for the example discoursed at this post it was used "Remote Linux Debugger".
 |
| Fig 08 - Select debugger interface on IDA |
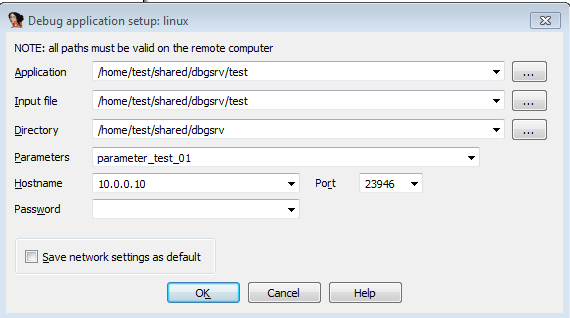
It will be also necessary to configure the debugger parameters and insert few informations about the Host environment. Figure 9 shows the debugger configuration interface and its parameters. Note that all information (IP address and file paths) are related to the Host environment. The configuration is set at the Windows machine but regarding the Linux environment (where the analyzed executable will be executed).
 |
| Fig 09 - Remote debugger configuration interface on IDA |
Voilà, IDA will connect to the server every time the analyst ask to execute the binary. This approach allows to observe the execution behavior of a binary hosted in a remote machine. The next two images (10 and 11) show a triggered breakpoint (on strncmp()) and the content of the register %rcx. By inspecting the parameters of strncmp() (addresses stored inside %rcx and %rax) it is possible to extract the necessary information to break the "challenge". It is possible to check that the software compared the first parameter of the executable with the string "password". If matches, the flag "Success!" is printed.
 |
| Fig 10 - Breakpoint on strncmp() function |
| Fig 11 - Analyzing the content of %rcx used as parameter for the strncmp() function. |
Another option for debugging ELF executables is to use the gdbserver application [7] which is just a stub for GDB and can be configured in a very similar way of the native debugging server provided by IDA. It is just necessary to start the gdbserver at the Host environment by using the "multi" parameter and defining a port. Figure 12 shows the command line necessary for execute the gdbserver binary in a Linux machine.
 |
| Fig 12 - gdbserver binary command line output. |
It is just necessary setup IDA to connect at this port by using the same method described for the linux_server64 server. Both approaches work very well. The main benefit of using gdbserver is that this server can be found pre-compiled in most of Linux package repositories.
.:: [Conclusions
Remote debugging can be an useful approach to analyze an executable file or a process in a remote machine. This technique is harmless to the Analysis environment and can be applied, for instance, for analyzing Malwares hosted into sandbox machines. Another very interesting application is to analyze binaries compiled for different architectures making use of all debugging and visualization features provided by IDA pro.
.:: [References:
[1] http://bochs.sourceforge.net/
[2] https://www.hex-rays.com/products/ida/
[3] http://www.ollydbg.de/
[4] https://www.hex-rays.com/products/ida/support/download_freeware.shtml
[5] http://www.howtogeek.com/168115/mount-a-windows-shared-folder-on-linux-with-samba/
[6] http://windows.microsoft.com/en-za/windows/share-files-with-someone
[7] http://linux.die.net/man/1/gdbserver
Of course, this is going to be exhausting when your bankroll starts to look too-thin-to-survive, but that's exactly when it's crucial that you hold your winnings separate from your gambling money. While I can't teach you the expertise , I can help you with right bets and the most effective roulette methods that won't|that will not} kill your bankroll. 80 spins at €1 per spin means you need €80 to stay on the desk for two 온라인카지노 complete hours earlier than your money is gone.
ReplyDelete